前言
Linux性能分析
- CPU性能
- 磁盘I/O性能
- 内存性能
- 网络性能
Linux大神Brendan D.Gregg的Linux Performance Tools

Virtual Memory
vmstat
vmstat:Virtual Meomory Statistics(虚拟内存统计),可对操作系统的虚拟内存、进程、CPU活动进行监控
vmstat 命令详解
使用 man vmstat 查看 vmstat 的使用说明
1 | vmstat [options] [delay [count]] |
vmstat常用命令
-
vmstat 2 1间隔2s采集一次服务器状态,1表示只采集一次1
2
3
4
5
6
7
8
9
10
11
12
13
14
15
16
17
18
19
20
21
22
23
24
25
26
27
28
29
30
31
32
33
34
35
36
37[xboom@localhost ~]$ vmstat 2 1
procs -----------memory---------- ---swap-- -----io---- -system-- ------cpu-----
r b swpd free buff cache si so bi bo in cs us sy id wa st
1 0 698692 70384 80 136748 159 827 4004 965 250 511 5 4 91 0 0
FIELD DESCRIPTION FOR VM MODE
Procs
r: The number of runnable processes (running or waiting for run time).
b: The number of processes in uninterruptible sleep.
Memory
swpd: the amount of virtual memory used.
free: the amount of idle memory.
buff: the amount of memory used as buffers.
cache: the amount of memory used as cache.
inact: the amount of inactive memory. (-a option)
active: the amount of active memory. has been recently userd (-a option)
Swap
si: Amount of memory swapped in from disk (kb/s)
so: Amount of memory swapped to disk (kb/s)
IO
bi: Blocks received from a block device (blocks/s). default 1024bytes per block
bo: Blocks sent to a block device (blocks/s).
System
in: The number of interrupts per second, including the clock.
cs: The number of context switches per second.
CPU
These are percentages of total CPU time.
us: Time spent running non-kernel code. (user time, including nice time)
sy: Time spent running kernel code. (system time)
id: Time spent idle. Prior to Linux 2.5.41, this includes IO-wait time.
wa: Time spent waiting for IO. Prior to Linux 2.5.41, included in idle.
st: Time stolen from a virtual machine. Prior to Linux 2.6.11, unknown.Active memory: This information is currently in memory, and has been recently used.
Inactive memory: This information in memory is not actively being used, but was recently used.
For example, if you’ve been using Mail and then quit it, the RAM that Mail was using is marked as Inactive memory. This Inactive memory is available for use by another application, just like Free memory. However, if you open Mail before its Inactive memory is used by a different application, Mail will open quicker because its Inactive memory is converted to Active memory, instead of loading Mail from the slower hard dis
-
vmstat -d查看磁盘信息1
2
3
4
5
6
7
8
9
10
11
12
13
14
15
16
17
18
19
20
21
22
23
24[xboom@localhost ~]$ vmstat -d
disk- ------------reads------------ ------------writes----------- -----IO------
total merged sectors ms total merged sectors ms cur sec
sda 73171 8499 7041491 19482 12371 181181 1645664 10221 0 23
sr0 52 0 2125 55 0 0 0 0 0 0
dm-0 46855 0 6696761 13980 5743 0 143320 2504 0 17
dm-1 32794 0 266008 6924 187764 0 1502112 308321 0 10
FIELD DESCRIPTION FOR DISK MODE
Reads
total: Total reads completed successfully
merged: grouped reads (resulting in one I/O)
sectors: Sectors read successfully
ms: milliseconds spent reading
Writes
total: Total writes completed successfully
merged: grouped writes (resulting in one I/O)
sectors: Sectors written successfully
ms: milliseconds spent writing
IO
cur: I/O in progress
s: seconds spent for I/O -
vmstat -p dev查看分区情况1
2
3
4
5
6
7
8[root@localhost ~]# vmstat -p /dev/sda1
sda1 reads read sectors writes requested writes
343 68386 34 456
FIELD DESCRIPTION FOR DISK PARTITION MODE
reads: Total number of reads issued to this partition,分区的读的次数
read sectors: Total read sectors for partition,分区的读扇区的次数
writes : Total number of writes issued to this partition,分区写的次数
requested writes: Total number of write requests made for partition,分区写请求次数 -
vmstat -m查看系统slab信息1
2
3
4
5
6
7
8
9
10
11
12[root@localhost ~]# vmstat -m
Cache Num Total Size Pages
isofs_inode_cache 92 92 704 46
fuse_inode 36 36 896 36
nf_conntrack 102 102 320 51
FIELD DESCRIPTION FOR SLAB MODE
cache: Cache name
num: Number of currently active objects
total: Total number of available objects
size: Size of each object
pages: Number of pages with at least one active objectslab:由于内核会有许多小对象,这些对象构造销毁十分频繁,比如i-node,dentry,这些对象如果每次构建的时候就向内存要一个页(4kb),这样就会非常浪费,为了解决这个问题,就引入了一种新的机制来处理在同一个页框中如何分配小存储区,而slab可以对小对象进行分配,这样就不用为每一个对象分配页框,从而节省了空间,内核对一些小对象创建析构很频繁,slab对这些小对象进行缓冲,可以重复利用,减少内存分配次数
-
vmstat -f显示从系统启动至今的fork(创建进程的系统调用)数量1
2[root@localhost ~]# vmstat -f
4319 forks
Block Device Int-块设备IO接口
pidstat
pidstat命令用于监视Linux内核当前正在管理的各个任务
pidstat 命令详解
使用 man pidstat 查看 pidstat 的使用说明, 进程(任务)相关统计
1 | pidstat [ -d ] [ -H ] [ -h ] [ -I ] [ -l ] [ -R ] [ -r ] [ -s ] [ -t ] [ -U [ username ] ] [ -u ] [ -V ] [ -v ] [ -w ] [ -C comm ] [ -G process_name ] [ --human ] [ -p { pid [,...] | SELF | ALL } ] [ -T { TASK | CHILD | ALL } ] [ interval [ count ] ] [ -e program args ] |
pidstat常用命令
-
pidstat 2 5每两秒钟显示一次系统中每个活动任务的CPU统计信息的五个报告1
2
3
4
5
6
7
8
9
10
11
12
13
14
15
16
17
18
19
20
21
22
23[xboom@localhost ~]$ pidstat 2 5
Linux 4.18.0-193.10.el8.x86_64 (localhost.localdomain) 2020年10月10日 _x86_64_ (1 CPU)
23时10分13秒 UID PID %usr %system %guest %wait %CPU CPU Command
23时10分16秒 1000 5605 0.00 0.50 0.00 0.00 0.50 0 pidstat
23时10分16秒 UID PID %usr %system %guest %wait %CPU CPU Command
23时10分18秒 0 5569 0.00 0.50 0.00 0.00 0.50 0 kworker/0:1-ata_sff
23时10分18秒 1000 5605 0.00 0.50 0.00 0.00 0.50 0 pidstat
23时10分18秒 UID PID %usr %system %guest %wait %CPU CPU Command
23时10分20秒 0 4130 0.50 0.00 0.00 0.00 0.50 0 sssd_kcm
23时10分20秒 1000 5605 0.50 0.00 0.00 0.00 0.50 0 pidstat
23时10分20秒 UID PID %usr %system %guest %wait %CPU CPU Command
23时10分22秒 1000 5605 0.00 0.50 0.00 0.00 0.50 0 pidstat
23时10分22秒 UID PID %usr %system %guest %wait %CPU CPU Command
平均时间: UID PID %usr %system %guest %wait %CPU CPU Command
平均时间: 0 4130 0.10 0.00 0.00 0.00 0.10 - sssd_kcm
平均时间: 0 5569 0.00 0.10 0.00 0.00 0.10 - kworker/0:1-ata_sff
平均时间: 1000 5605 0.10 0.30 0.00 0.00 0.40 - pidstat -
pidstat -d报告I/O统计信息(仅内核2.6.20及更高版本)1
2
3
4
5
6
7
8
9
10
11
12
13
14
15[xboom@localhost ~]$ pidstat -d
Linux 4.18.0-193.10.el8.x86_64 (localhost.localdomain) 2020年10月10日 _x86_64_ (1 CPU)
23时11分56秒 UID PID kB_rd/s kB_wr/s kB_ccwr/s iodelay Command
23时11分56秒 1000 2050 0.99 0.00 0.00 12 dbus-daemon
23时11分56秒 1000 2052 0.81 0.00 0.00 0 gdm-wayland-ses
23时11分56秒 1000 2056 28.68 0.07 0.00 6 gnome-session-b
23时11分56秒 1000 2104 197.84 0.05 0.00 199 gnome-shell
23时11分56秒 1000 2167 4.47 0.00 0.00 6 Xwayland
kB_rd/s 每秒从磁盘读取任务的千字节数
kB_wr/s 每秒磁盘写入任务的千字节数
kB_ccwr/s 任务已取消其写入磁盘的千字节数。 当任务截断一些脏页缓存时,可能会发生这种情况。
在这种情况下,一些IO另一个任务已被考虑将不会发生
iodelay 任务的块I/O延迟,以时钟周期为单位。该指标包括等待同步块I/O完成和交换块I/O完成 -
pidstat -r报告页面错误和内存利用率1
2
3
4
5
6
7
8
9
10
11
12
13
14
15
16
17
18
19
20[xboom@localhost ~]$ pidstat -r
Linux 4.18.0-193.10.el8.x86_64 (localhost.localdomain) 2020年10月10日 _x86_64_ (1 CPU)
23时16分42秒 UID PID minflt/s majflt/s VSZ RSS %MEM Command
23时16分42秒 0 1 3.02 0.23 245432 5032 0.62 systemd
23时16分42秒 0 725 0.19 0.19 104716 2700 0.33 systemd-journal
23时16分42秒 0 757 0.65 0.02 118924 420 0.05 systemd-udevd
23时16分42秒 32 885 0.05 0.00 67124 144 0.02 rpcbind
23时16分42秒 0 888 0.03 0.01 143108 48 0.01 auditd
23时16分42秒 0 890 0.03 0.00 48488 20 0.00 sedispatch
23时16分42秒 998 927 6.24 0.12 1634948 2484 0.31 polkitd
minflt/s 任务每秒发生的次要错误,不需要从磁盘中加载页
majflt/s 任务每秒发生的主要错误,需要从磁盘中加载页
VSZ 虚拟地址大小,虚拟内存的使用KB
RSS 常驻集合大小,非交换区五里内存使用KB
MEM 任务当前使用的可用物理内存份额
当报告任务及其所有子任务的全局统计信息时,可能会显示以下值:
minflt-nr 任务及其所有子项所产生的次要错误总数
majflt-nr 任务及其所有子项所产生的主要错误总数 -
pidstat -s报告堆栈利用率1
2
3
4
5
6
7
8
9
10
11
12[xboom@localhost ~]$ pidstat -s
Linux 4.18.0-193.10.el8.x86_64 (localhost.localdomain) 2020年10月10日 _x86_64_ (1 CPU)
23时18分36秒 UID PID StkSize StkRef Command
23时18分36秒 1000 2016 132 16 systemd
23时18分36秒 1000 2037 132 4 pulseaudio
23时18分36秒 1000 2050 132 12 dbus-daemon
23时18分36秒 1000 2052 132 4 gdm-wayland-ses
23时18分36秒 1000 2056 132 8 gnome-session-b
StkSize 为任务保留为堆栈的内存量(以KB为单位),但不一定使用。
StkRef 任务引用的用作堆栈的内存量(以KB为单位) -
pidstat -u报告CPU利用率1
2
3
4
5
6
7
8
9
10
11
12
13
14
15
16
17
18
19[xboom@localhost ~]$ pidstat -u
Linux 4.18.0-193.10.el8.x86_64 (localhost.localdomain) 2020年10月10日 _x86_64_ (1 CPU)
23时20分26秒 UID PID %usr %system %guest %wait %CPU CPU Command
23时20分26秒 0 1 0.00 0.03 0.00 0.07 0.03 0 systemd
23时20分26秒 0 2 0.00 0.00 0.00 0.00 0.00 0 kthreadd
23时20分26秒 0 9 0.00 0.01 0.00 0.03 0.01 0 ksoftirqd/0
23时20分26秒 0 10 0.00 0.00 0.00 0.81 0.00 0 rcu_sched
usr 用户太CPU占比,不包含虚拟处理器(虚拟处理器)所花费时间
system 内核态CPU占比
guest 虚拟机CPU占比
wait 等待IO的CPU占比
CPU 总的CPU利用率,如果在多处理器环境中,添加参数 -I,该值将除以总的CPU个数
CPU 进程运行的CPU id
当报告任务及其所有子任务的全局统计信息时,可能会显示以下值:
usr-ms 用户态任务及其所有子项花费的毫秒总数
system-ms 内核态任务及其所有子项花费的毫秒总数
guest-ms 虚拟处理器任务及其所有子项花费的毫秒总数 -
pidstat -v内核表信息1
2
3
4
5
6
7
8
9
10[xboom@localhost ~]$ pidstat -v
Linux 4.18.0-193.10.el8.x86_64 (localhost.localdomain) 2020年10月10日 _x86_64_ (1 CPU)
23时22分03秒 UID PID threads fd-nr Command
23时22分03秒 1000 2016 1 25 systemd
23时22分03秒 1000 2037 3 36 pulseaudio
23时22分03秒 1000 2050 2 71 dbus-daemon
threads 当前任务关联线程数
fd-nr 当前任务关联文件描述符 -
pidstat -w显示上下文切换1
2
3
4
5
6
7
8
9
10
11
12
13
14
15[xboom@localhost ~]$ pidstat -w
Linux 4.18.0-193.10.el8.x86_64 (localhost.localdomain) 2020年10月10日 _x86_64_ (1 CPU)
23时23分28秒 UID PID cswch/s nvcswch/s Command
23时23分28秒 0 1 0.79 0.27 systemd
23时23分28秒 0 2 0.03 0.00 kthreadd
23时23分28秒 0 3 0.00 0.00 rcu_gp
23时23分28秒 0 4 0.00 0.00 rcu_par_gp
23时23分28秒 0 6 0.00 0.00 kworker/0:0H-kblockd
cswch/s 每秒执行的任务的自愿上下文切换总数。
自愿的上下文切换:进程无法获取所需资源导致,如 I/O、内存等系统系统资源不足。
nvcswch/s 每秒执行的任务的非自愿上下文切换总数。
非自愿的上下文切换:是指进程由于时间片已到等原因,被系统强制调度,进而发生的上下文切换。
比如说,大量进程都在争抢 CPU 时,就容易发生非自愿上下文切换
I/O Controller
iostat
iostat命令用于通过观察设备活动的时间及其平均传输速率来监视系统输入/输出设备的负载。
iostat命令生成可用于更改系统配置的报告,以更好地平衡物理磁盘之间的输入/输出负载
iostat 命令详解
使用 man iostat 查看 iostat 的使用说明, 进程(任务)相关统计
1 | iostat [ -c ] [ -d ] [ -h ] [ -k | -m ] [ -N ] [ -s ] [ -t ] [ -V ] [ -x ] [ -y ] [ -z ] [ -j { ID | LABEL | PATH | UUID | ... } ] [ -o JSON ] [ [ -H ] -g group_name ] [ --human ] [ -p [ device [,...] | ALL ] ] [ device [...] | ALL ] [ interval [ count ] ] |
iostat常用命令
-
iostat自启动报告以来,显示所有CPU和设备的单个历史记录
1
2
3
4
5
6Device: 此列提供 /dev 目录中列出的设备(或分区)名称
tps: 表示每秒发送到设备的I/O请求次数。多个逻辑请求可以组合成对设备的单个I/O请求。传输的大小不确定。
Blk_read/s(kB_read/s, MB_read/s): 表示从设备读取的数据量,以每秒的块数(千字节,兆字节)表示。块等同于扇区,因此大小为512B
Blk_wrtn/s(kB_wrtn/s, MB_wrtn/s): 表示写入设备的数据量,以每秒的块数(千字节,兆字节)表示。
Blk_read (kB_read, MB_read): 读取的总块数(千字节,兆字节)。
Blk_wrtn (kB_wrtn, MB_wrtn): 写入的总块数(千字节,兆字节)。 -
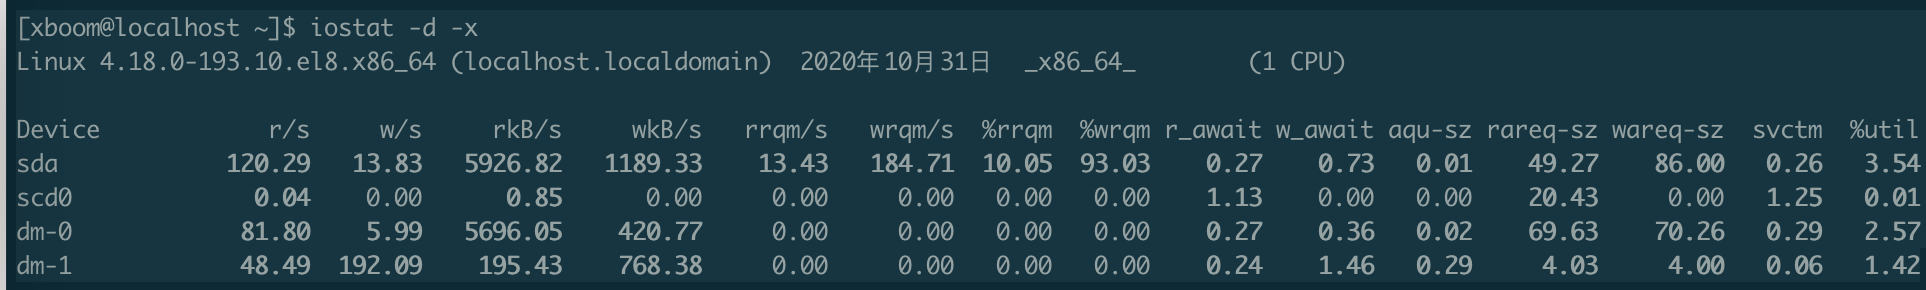
iostat -x 显示IO拓展信息
1
2
3
4
5
6
7
8
9
10
11
12
13
14
15
16
17
18Device: 此列提供 /dev 目录中列出的设备(或分区)名称
r/s: 每秒设备完成的读取请求数(合并后)
w/s: 每秒设备完成的写请求数(合并后)
rsec/s (rkB/s, rMB/s): 每秒从设备读取的扇区数(千字节,兆字节)
wsec/s (wkB/s, wMB/s): 每秒写入设备的扇区数(千字节,兆字节)
rrqm/s: 每秒合并到设备中的读取请求数
wrqm/s: 每秒合并到设备中的写入请求数
rrqm: 读取请求(已合并)的百分比
wrqm: 写入请求(已合并)的百分比
r_await: 发送给要服务的设备的读取请求的平均时间(以毫秒为单位)包括队列中的请求所花费的时间以及为请求服务所花费的时间
w_await: 发布给要服务的设备的写请求的平均时间(以毫秒为单位)包括队列中的请求所花费的时间以及为请求服务所花费的时间
aqu-sz: 发出到设备的请求的平均队列长度。注意:在以前的版本中 此字段称为avgqu-sz
rareq-sz: 发出给设备的读请求的平均大小(以千字节为单位)
wareq-sz: 发出给设备的写请求的平均大小(以千字节为单位)
svctm: 发出给设备的 I/O 请求的平均服务时间(以毫秒为单位)警告!不再信任此字段。 将来的sysstat版本中将删除此字段
util: 向设备发出 I/O 请求的经过时间的百分比(设备的带宽利用率)
当该值接近100%时,发生设备饱和用于串行服务请求的设备
对于并行处理请求的设备(例如RAID阵列和现代SSD)此数字并不反映其性能限制